
US Disability Uninsured State by State (2023)
Health Insurance (or rather lack of health insurance) is the second major measure that we can use to assess the overall safety net for disabled people in different states in the US. Disability Uninsured rates are very highly correlated between disabled people and undisabled people in each state with differences of less than 5% either way.
This is good news… and bad news. Good in that states don’t strongly discriminate in health insurance against disabled people .. bad news in that some states are really bad at ensuring that everyone has health insurance. The overall rates for health insurance for disabled people ranges between 3.33% and 17.45% and for non-disabled people between 3.22% and 21.77%
In fact, in a number of states there are modestly fewer disabled people without insurance than those without disabilities (I suspect that this is due to more Medicaid eligibility for disabled people as a long term health insurance support).
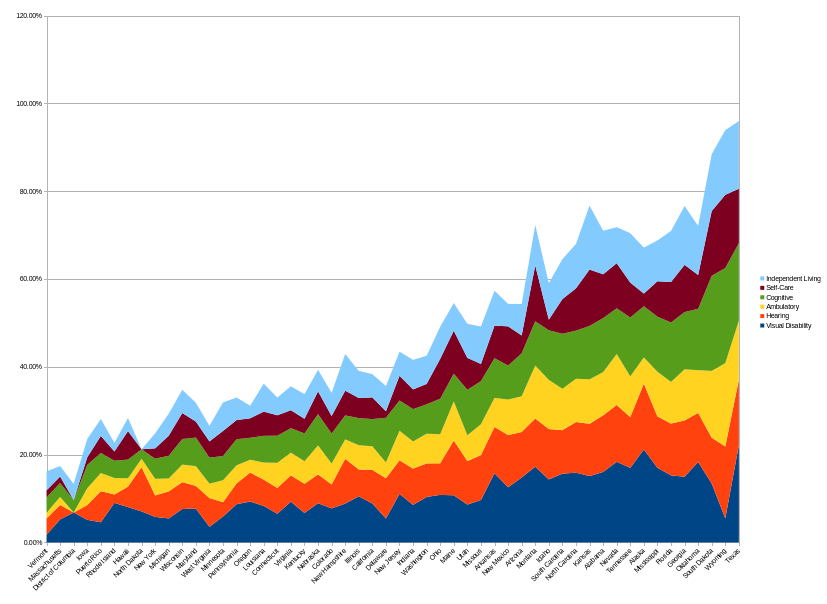
These numbers also vary widely between the 6 disability categories tracked the the US Census (Vision, Hearing, Ambulatory, Cognitive, Self-Care, and Independent Living). This report is derived from the very nice disabilitystatistics.org online site. They have a nice tool that allows you to play around with the Census data.
The results for each state do seem to correlate pretty strongly with the overall trends between states – and where there is a lot of variability, it may be due to small sample sizes.
The purpose of this report is fourfold:
- Give you insight into how your current state is doing and where they can do better.
- Give you information on other states to consider relocating to in order to have better services and supports.
- Challenge states to do better because MUCH BETTER IS POSSIBLE.
- Look at where there may be systemic issues with our disability services systems to drive down the number of uninsured.
My plan is to expand this report (and make it a lot slicker :) ) to provide an overall report card. I think the 3 main metrics to “judge” states for disability services are:
- Poverty
- Uninsured (Healthcare)
- Employment
- Life Expectancy
The first two are drawn from the American Community Survey (ACS) 1-year dataset. These reports lag by 2 years (and I’ve got some homework to be able to use the latest data).
I want to look at both full and part-time employment (also from the ACS survey).. though this can be tricky for some disabled people as they need to limit their income to preserve eligibility for Medicaid. I also want to look into the data for disabled people who live in institutional settings.
Life Expectancy is from the 10 year census… and I haven’t worked with that at all … yet.
If there are other metrics you think should be part of a report card (Employment, income, ..)… let me know. It is not that I’m not interested in those areas or planning to get into them, but I think these are the “core” metrics… but I’m willing to be convinced otherwise.
Overall US Disability Uninsured Leaders and Laggards
The Vermont leads with the lowest disability uninsured rate of 3.33%, followed by Massachusetts (3.49%), District of Columbia (3.75%), Iowa (4.39%), and Puerto Rico (4.43%). Except for Massachusetts, all of these states have small populations, so the data may be affected by sampling errors.
Georgia sits at 48th (13.67%), Oklahoma at 49th (14.28%), South Dakota at 50th (16.67%), Wyoming at 51st (16.83%), and Texas decisively in last at 17.45%… no small state sampling problem there, unfortunately.
The range between the top sate – 3.33% to 17.45% clearly shows opportunities for improvements and some real concerns related to the bottom states.
California sits at 5th at 6.93%… if you have questions about your state, shoot me a note. My plan is to build a complete report, but I want to use direct Census data.
Understanding overall disability uninsured rates gives another good measure for the quality (and quantity!) of the overall state systems, there are differences for different disability populations (as seen below), but the overall trends seem to be dominated by the each state’s approach to healthcare.
One area to investigate further is the numbers of people in Medicaid to see if some state-by-state differences drive the uninsured outcomes (there is a lot of good research on “Administrative Burdens” for benefit programs – and these are likely to get worse as changes to Medicaid start showing up in uninsured metrics).
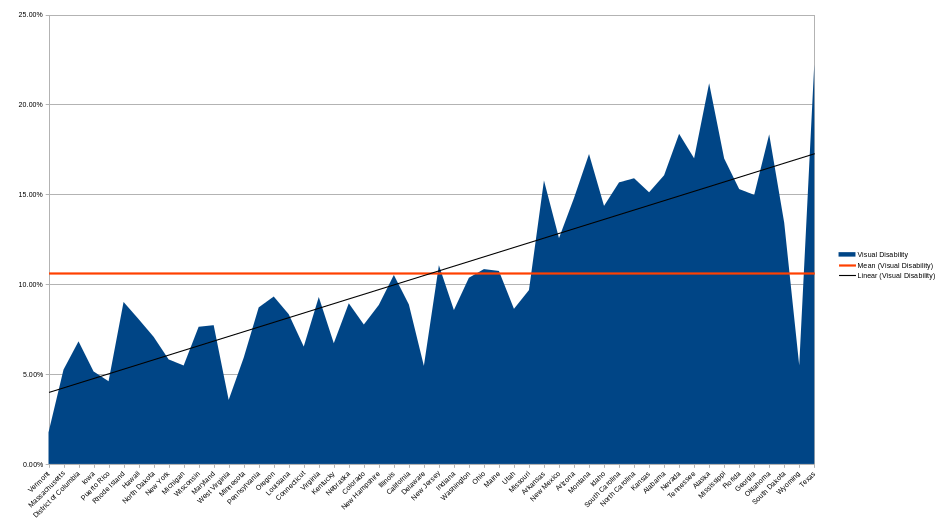
Visual Disability Uninsured State-level Performance
Vermont is the clear leader for low uninsured rate for visual disabilities at 1.75%…but the small state population is likely a contributing factor as West Virginia sits at 2nd at 3.56%, followed by Puerto Rico (4.50%), Iowa (5.14$) and Massachusetts (5.25%).
Montana sits at 48th (17.24%), ahead of Oklahoma at 49th (18.34%), Nevada at 50th (18.36%), Alaska at 51st (21.10%) and Texas trailing – 52nd at 22.21%.
California is at 24th (8.87%).
The range is quite wide at 1.75% to 22.21%.
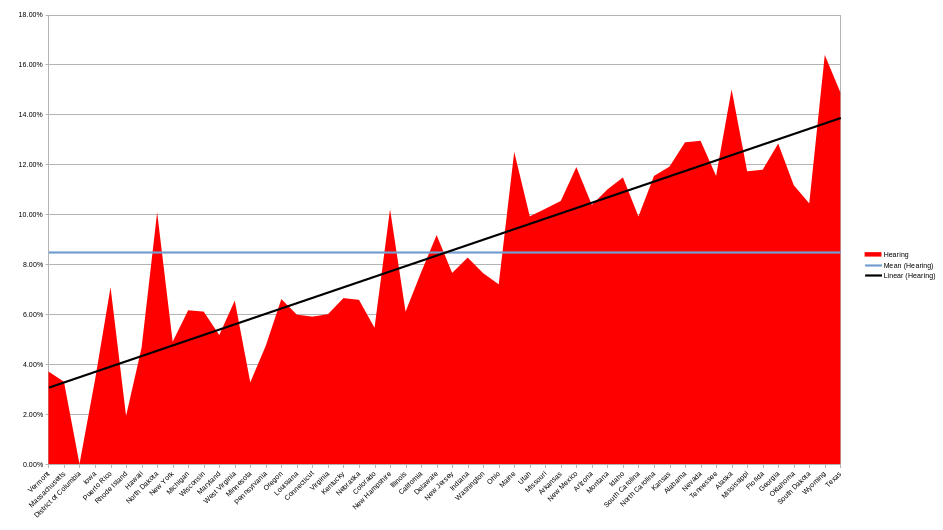
Hearing Disability Uninsured State-level Performance
The District of Columbia is in the lead at (0.00%)… almost certainly a sampling hiccup. Rhode Island 2nd at (1.92%), Minnesota 3rd at (3.27%), Massachusetts 4th at 3.29%, and Iowa in 5th at 3.37%.
The trailing cluster starts with Maine at 46th (12.50%), Georgia at 47th (12.83%), Alabama at 48th (12.88%), and Nevada at 49th (12.94%) with Texas at 50th (14.89%), Alaska at 51st (15.02%), and Wyoming at 52nd (16.38%) clearly at the bottom.
… and California is again at 25th with 7.67%.
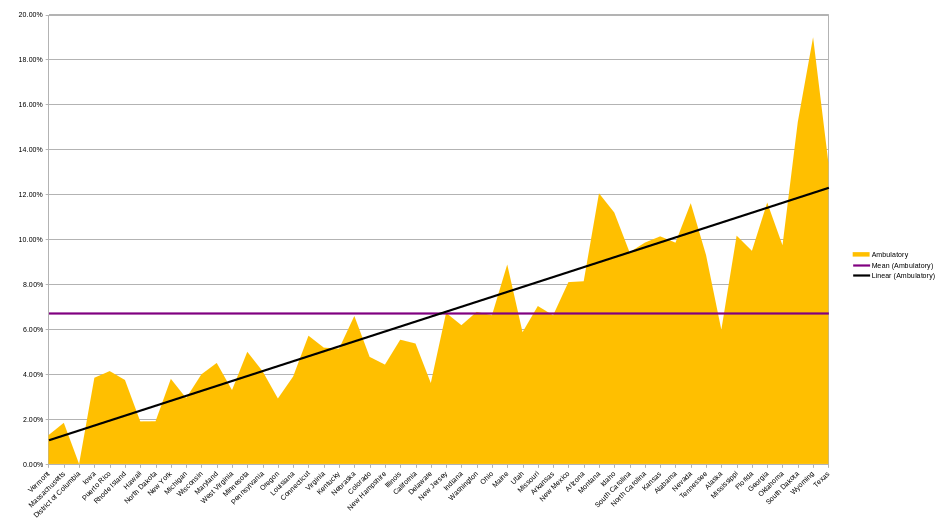
Ambulatory Disability Uninsured State-level Performance
The District of Columbia is again in the lead at (0.00%)… almost certainly a sampling hiccup. Vermont is 2nd (1.28%), Massachusetts is 3rd (1.83%), followed by Hawaii at 4th (1.89%) and North Dakota in 5th (1.90%).
The bottom five are led by Georgia at 48th (11.63%), Montana at 49th (12.04%), Texas at 50th (13.41%), South Dakota at 51st (15.22%), and Wyoming at 52nd (18.99%).
California is 23rd at (5.36%).
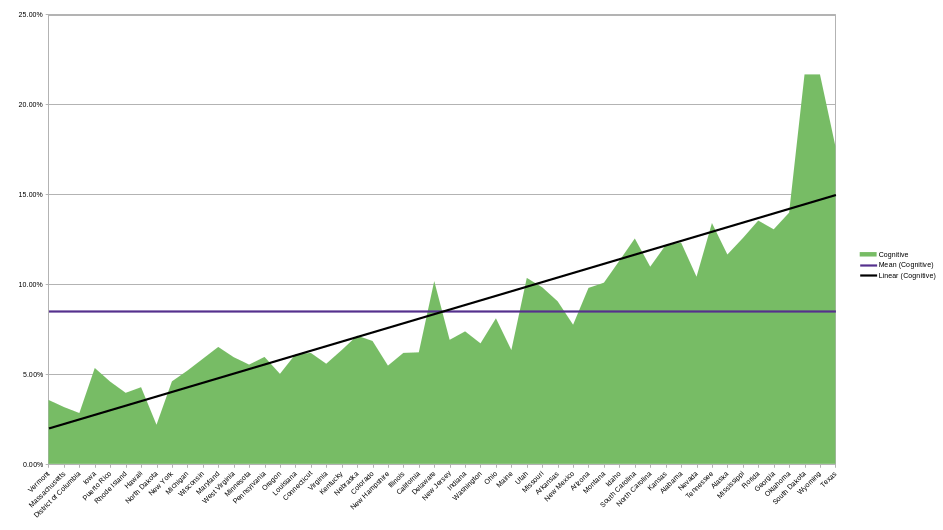
Cognitive Disability Uninsured State-level Performance
North Dakota has the lowest rate of uninsured (2.17%), followed by the District of Columbia (2.82%), Massachusetts (3.16%), Vermont (3.56%), and Rhode Island (3.95%).
The bottom 5 are Florida at 48th (13.54%), then Oklahoma (13.99%), with a jump to Texas (17.67%), and then a tie for last Wyoming (21.67%) and South Dakota (21.67%).
California is 21st at (6.20%)
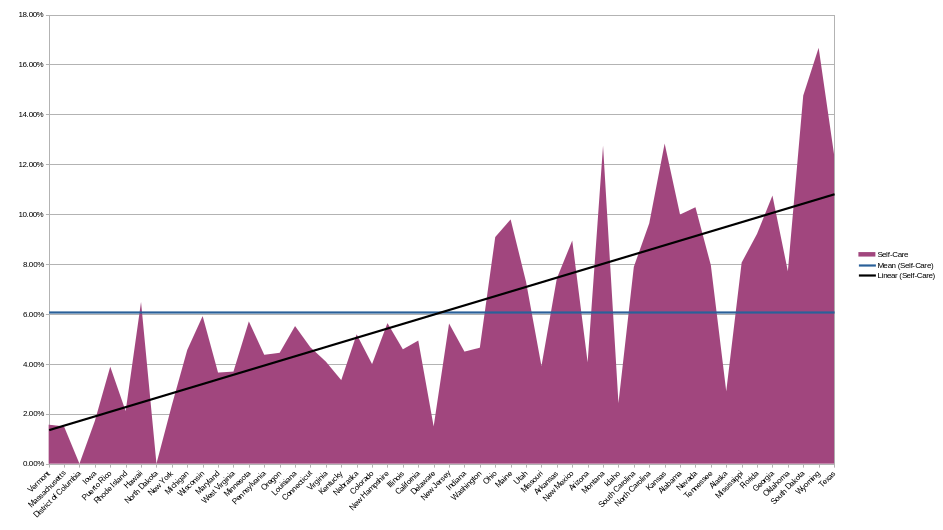
Self-Care Disability Uninsured State-level Performance
Both North Dakota and the District of Columbia record no self-care disability uninsured (0.00%)… certainly a small sample size problem. Followed by Massachusetts (1.49%) and Delaware (1.49%) with Vermont closing out the top 5 (1.71%).
Texas is the “best of the worst” for self-care disability uninsured – 48th (12.39%). Followed by Montana (12.75%), Kansas (12.83%), South Dakota (14.75%), and Wyoming solidly in last (16.67%).
California is 26th at 4.93%.
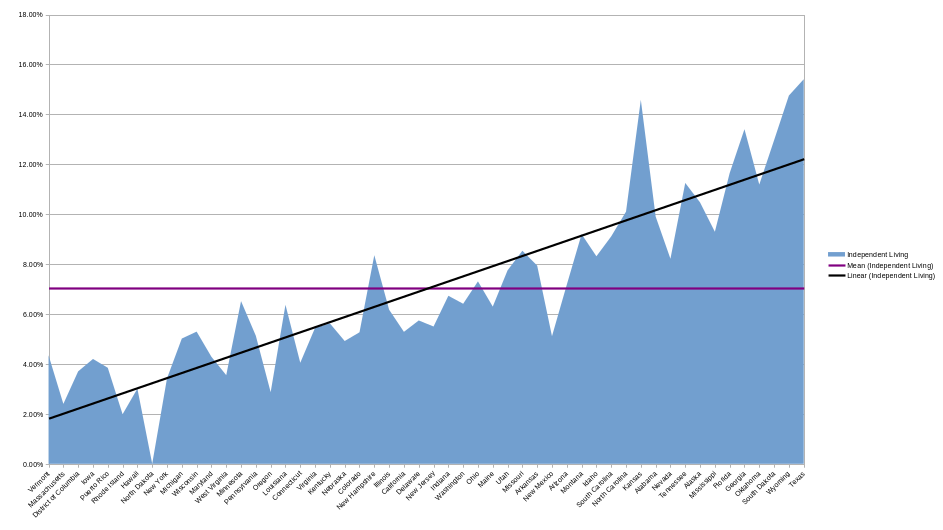
Independent Living Disability Uninsured State-level Performance
North Dakota records no independent living disability uninsured (0.00%)…the small sample size problem strikes again. Rhode Island is next (1.98%( followed by Massachusetts (2.40%), Oregon (2.87%) and Hawaii (3.01%).
The bottom 5 states are South Dakota in 48th (12.96%), followed by Georgia (13.41%), Kansas (14.58%), Wyoming (14.75%) and Texas trailing at (15.41%).
California is 19th at 5.29%.
Next Steps
This is the first time that small sample problems seem to have had a big impact on a report. This is mitigated by the fact that specific disability doesn’t seem to be nearly as important a factor as it was with poverty, but rather the overall quality of the healthcare program for a state. The range between the two biggest states that show up in the top – Massachusetts (3.49%) and Texas (17.45%) does demonstrate that there is a real discussion to be had about how states handle (or don’t handle) healthcare uninsurance.
Unfortunately, we are gearing up to see even bigger impacts in this as the “Big Beautiful Bill”‘s impact on health insurance kicks in. Work requirements (or the administrative burden to respond to work requirements) should start showing up in the data that we can see in a couple of years.
The mix of healthcare coverage for disabled people as well as differentiating (if possible) between those with developmental disabilities and those whose disabilities occurred through work or in adulthood may provide some additional insight… if I can pull these differences out of the datasets… stay tuned.
I continue to learn a lot (and find even more questions) every time I do these analyses… if you have any questions or insights… let me know!