

US Disability Poverty State by State (2023)
If a state has low poverty for disabled people, it probably has pretty good disability systems and supports. It is pretty shocking how wide poverty rates vary by state and disability type. The aggregate disability poverty rate ranges from 16.54% in Utah to 34.26% in West Virginia (with Puerto Rico a depressing outlier at 48.37%) and a national average of 24.17%.
These numbers also vary widely between the 6 disability categories tracked the the US Census (Vision, Hearing, Ambulatory, Cognitive, Self-Care, and Independent Living). This report is derived from the very nice disabilitystatistics.org online site. They have a nice tool that allows you to play around with the Census data.
The purpose of this report is fourfold:
- Give you insight into how your current state is doing and where they can do better.
- Give you information on other states to consider relocating to in order to have better services and supports.
- Challenge states to do better because MUCH BETTER IS POSSIBLE.
- Look at where there may be systemic issues with our disability services systems to drive down poverty.
My plan is to expand this report (and make it a lot slicker :) ) to provide an overall report card. I think the 3 main metrics to “judge” states for disability services are:
- Poverty
- Uninsured (Healthcare)
- Life Expectancy
The first two are drawn from the American Community Survey (ACS) 1-year dataset. These reports lag by 2 years (and I’ve got some homework to be able to use the latest data).
Life Expectancy is from the 10 year census… and I haven’t worked with that at all … yet.
If there are other metrics you think should be part of a report card (Employment, income, ..)… let me know. It is not that I’m not interested in those areas or planning to get into them, but I think these are the “core” metrics… but I’m willing to be convinced otherwise.
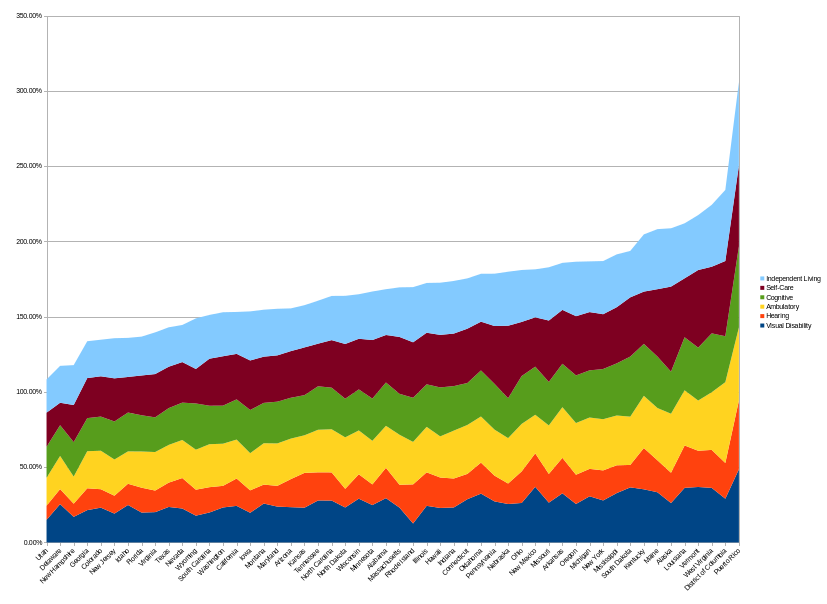
We’ve got to talk about Puerto Rico – the Twice Exceptionally Screwed non-state
Poverty in Puerto Rico is much higher for disabled people than in any other state in the US (NOTE – it is possible that the situation is similar in other territories, but this is not reported in the ACS surveys). That Puerto Rico’s disability poverty rate is 14% higher than West Virginia’s is pretty devastating.
The huge gap (14%) between Puerto Rico and West Virginia is the same as the gap between West Virginia and Idaho… Ranked 6th in the US.
Previously, I had stumbled on to the grim fact that US law (upheld by the courts) EXCLUDED disabled Puerto Rican’s from SSI (Supplemental Security Income – a benefits program that is basically in place for people the US considers quite disabled)… is quite petty and cruel… the “reason” that they are excluded is that residents of Puerto Rico don’t pay standard income tax?!?!
People who are eligible for SSI are highly unlikely to be able to work or earn a substantial income.
So, second class US citizens with second class status with third class (or less) public services.
Shameful.
Overall US Disability Poverty Leaders and Laggards
Utah stands clearly at the top of total rankings with a disability poverty rate of 16.5% followed by New Hampshire at 17.7% with Delaware (18.4%) and Colorado (18.5%) very close together and New Jersey at 19.4% rounding out the top 5.
Excluding Puerto Rico (48.4%), Vermont sits in 47th (30.3%) poverty rate, then Kentucky (30.5%), Louisiana (32.1%), District of Columbia (33.8%) and West Virginia (34.2%).
California sits at 22.4%… if you have questions about your state, shoot me a note. My plan is to build a complete report, but I want to use direct Census data.
Understanding overall disability poverty rates gives a good sense of the quality (and quantity!) of the overall state system, but there are meaningful differences in services for people with different disabilities.
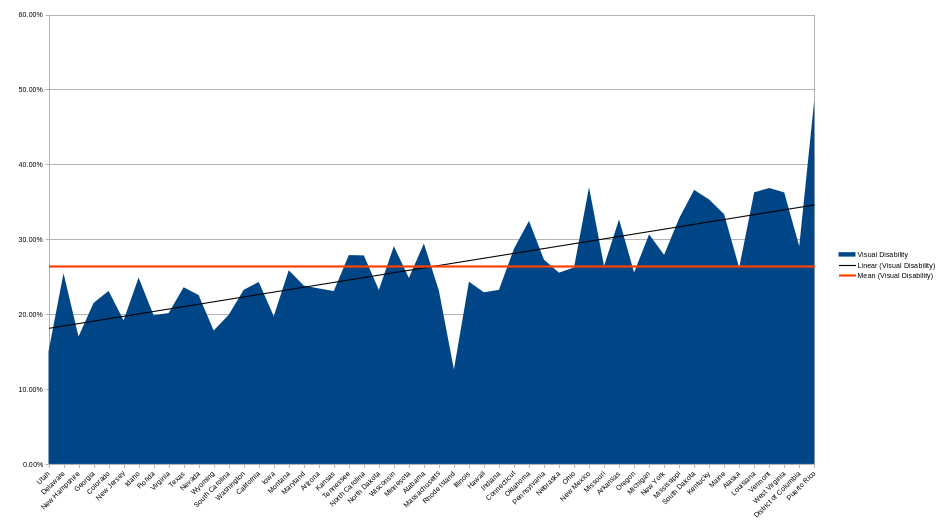
Visual Disability Poverty State-level Performance
Rhode Island is the leader with only 12.6% poverty rate for people with visual disabilities. Utah comes next at 15% followed by New Hampshire (17.01%) and Wyoming (17.81%). New Jersey rounds out the top 5 at 19.17%, followed closely by Iowa (19.85%) and Florida (19.9%).
The bottom 5 have West Virginia (36.25%), Louisiana (36.26%) and South Dakota (36.59%) close together with Vermont (36.84%) and finally New Mexico (36.95%)… given statistical variations, there is little difference between these states.
Once again, Puerto Rico stands alone at 48.59%.
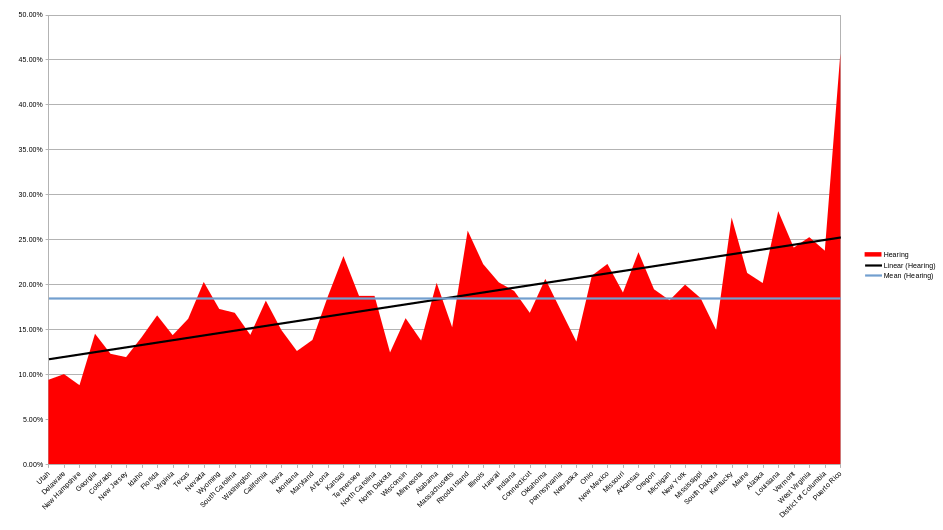
Hearing Disability Poverty State-level Performance
New Hampshire has the to spot with only 8.76% poverty rate for people with hearing disabilities. Utah comes in second at 9.37% followed by Delaware at 10%. New Jersey (11.89%) and Colorado (12.25%) round out the top 5.
The bottom 5 are Vermont (24.07%), West Virginia (25.23%), Rhode Island (25.96%), Kentucky (27.42%) and Louisiana (28.13%).
… and California is down at 25th with 18.17%.
Puerto Rico is at 45.66%
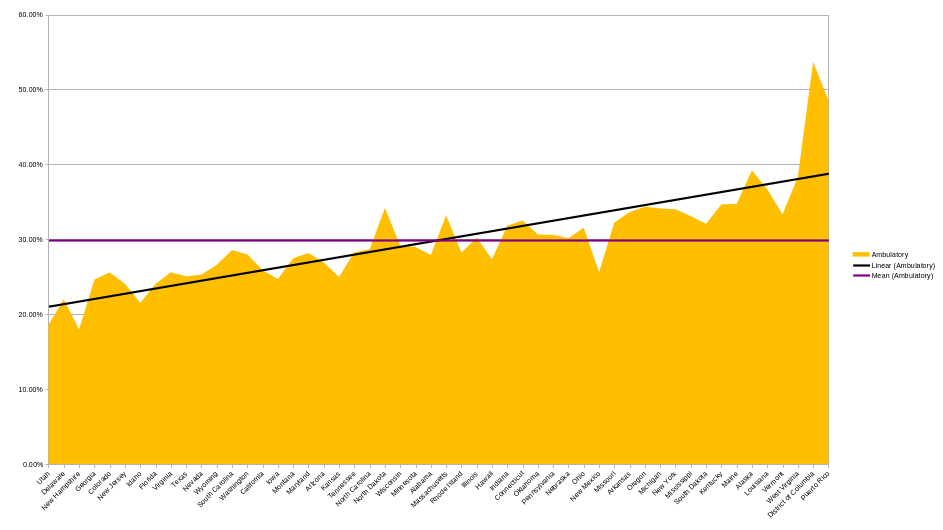
Ambulatory Disability Poverty State-level Performance
New Hampshire leads with 17.96% poverty rate for people with ambulatory disabilities, followed by Utah at 18.57%. Idaho (21.51%), Delaware (22%), and Florida (24.04%) trail with Georgia (24.62%) and Iowa (24.68%) not far behind.
The bottom five are Louisiana (36.68%), West Virginia (38.31%), Alaska (39.2%) with a big gap until Puerto Rico (48.58%) and District of Columbia in last at (53.66%).. ouch.
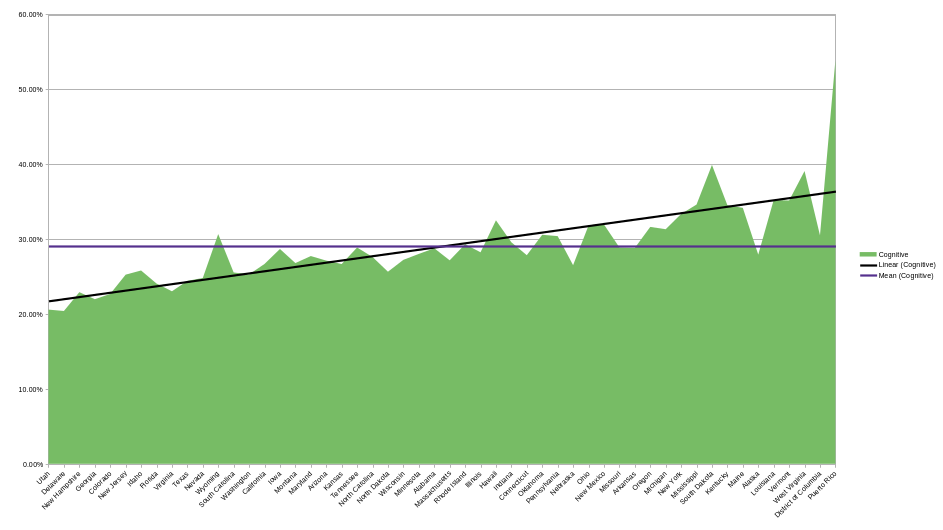
Cognitive Disability Poverty State-level Performance
Delaware (20.41%) and Utah (20.59%) are close in the lead with the lowest poverty rates for people with cognitive disabilities. They are followed by Georgia (21.98%), Colorado (22.69%), and New Hampshire (22.92%).
The bottom 5 are Mississippi (34.62%), Vermont (35.16%), Louisiana (35.23%), with West Virginia (39.10%) and South Dakota (39.92%) clearly behind.
Alas, Puerto Rico stands alone at 53.91% poverty rate for those with cognitive disabilities.
Self-Care Disability Poverty State-level Performance
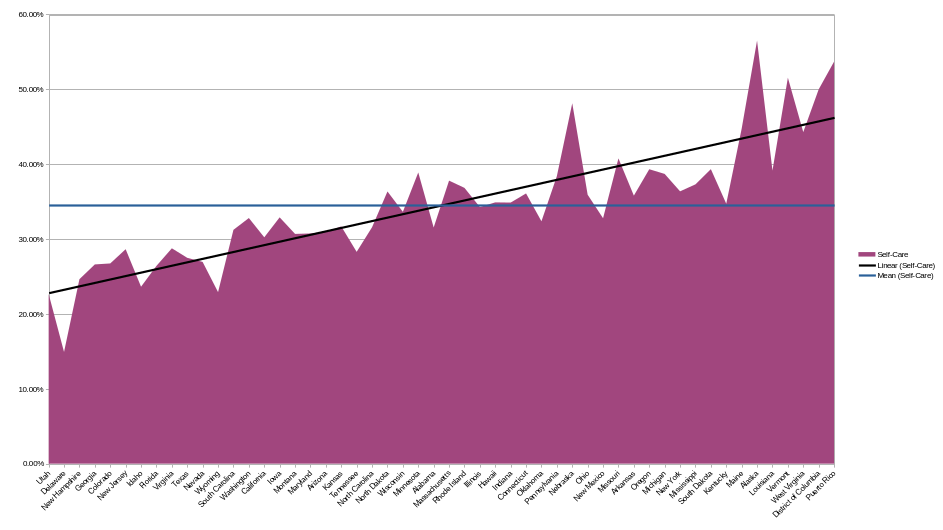
Delaware (14.93%) is far in the lead in the area of low poverty rate for those with a self-care disability (this is a clear case of where a small state with a small sample size have odd survey results – their 90% confidence interval is +/- 13.33%!). Utah (22.67%), Wyoming (22.92%), Idaho (23.64%), and New Hampshire (24.65%) round out the top 5.
The bottom 5 are Nebraska (48.15%), District of Columbia (50%), Vermont (51.56%), Puerto Rico (53.71%) and Alaska (56.52%).
A lot of the state sample sizes are pretty small with large confidence intervals making the results less clear than I’d like. I’ll try to include a visualization of this in a future version of this report.
Independent Living Disability Poverty State-level Performance
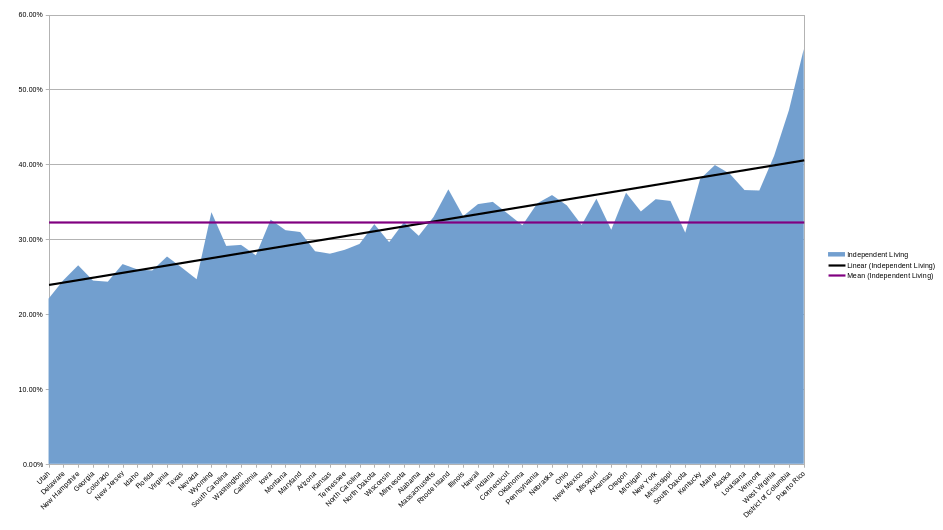
Utah (22.06%) is the leader for low poverty rate for those with an independent living disability. They are followed by Colorado (24.32%), Georgia (24.47%), Delaware (24.52%), and Nevada (24.64%) all in a cluster.
The bottom 5 states for poverty rate for those with an independent living disability are Kentucky (38.02%), Alaska (38.74%), Maine (39.90%), West Virginia (41.12%), and the District of Columbia (47.22%).
Puerto Rico again is alone at 55.38%.
Next Steps
These metrics give a good sense of how each state does overall in minimizing disability poverty. I suspect this is a side effect of the overall success of the state systems. It is certainly important to note that these are surveys and, in some cases, the error ranges are pretty wide. However, as seen in the aggregate state results, things are pretty consistent between disability categories… so the trends are probably pretty solid.
An area where I’m going to look for more data is for individuals who live in “institutional housing” to see if that has an effect on these numbers.
Next up… something else, but the next metrics area is going to be % of disabled people who are uninsured.